Why statistics matter?
Table Of Contents

We just celebrated the 8th anniversary of the W3C specification document Identifiers for WebRTC’s Statistics API.
First used by the Chrome team for debugging, WebRTC’s statistics have become a must-have even if today these APIs are still not completely standardized.
In this article, I’ve summarized why the getStats Statistics API is so important and why collecting and measuring WebRTC calls help to improve the quality of the product you are developing.
The long story of WebRTC statistics
Prior to the standardized W3C getStats API, Chrome delivered in 2013 (not completely sure about the timeline) a special page to access and debug WebRTC live information called chrome://webrtc-internals as well as a first getStats API implementation based on callback.
WebRTC-internals has helped and continues to help a lot of WebRTC developers working with Chrome by showing what happens in live. At that time, the problem was that there was no equivalent tool for Firefox (WebRTC wasn’t yet available in Safari) and so in case of an issue saw in Firefox, you should cross the fingers that using Chrome and Firefox, you were able to capture something relevant for Firefox from the Chrome webRTC-internals tool or to be able to understand the Firefox debugger…
Regarding the getStats API exposed by Chrome, without standardization yet, Chrome proposed something and tried to obtain consensus from others.
In 2014, hopefully, the W3C started to standardize this API to collect live the WebRTC statistics directly from the JavaScript application. The Chrome implementation was debated to have a definition that fits to other stakeholders.
Chrome continued to expose its own API, and we needed to wait for 2017 to see Chrome offering a standardized API by using a Promise instead of a callback (while the previous one remains available).
Additionally, Chrome exposed specific properties the googXXX that developers have used but that were renamed, moved to different reports or never standardized: A dedicated hitchhiker’s guide was edited to help developers to move to the right direction: The Chrome Standard getStats() Migration Guide.
Until recently, the getStats API was clearly under-implemented by other browsers meaning that except Chrome, a lot of properties were missing from reports or some reports were completely absent in Firefox and Safari. Hopefully, recent changes showed that the implementation goes to the right direction, but Firefox is still far behind in the last implementation report.
In last Chrome version (eg: M106), there are still a lot of changes around Statistics that can’t be seen as just polishing the API surface but rather sort of breaking changes that force developers to update their codebase…
All this, plus the fact that the specification is still not finalized, show us that the work on statistics is still in progress: Positive sign is that we have access to more and more statistics to analyze and that help improving our applications.
Caveat for inexperienced developers
Even if there is only one API to know, collecting and using WebRTC statistics that comes from the getStats API is still something not easy to do.
From my perspective, this is mainly due to the following problems:
-
Statistics are not at the same level depending on the browser used,
-
JavaScript API is based on an
Iterator, -
Concepts used required strong WebRTC skills.
Browser compatibility
Just have a look to the Web Platform tests dashboard and filter on the WebRTC-Stats.

Nothing more to say… Browsers have still work to do to be specification’s compliant. In their defense, the specifications are not finished and new statistics appear monthly.
Note: Don’t take for granted the statistics found in Chrome… If they are not in the spec, it is better to wait most of the time. Could be seen as a first try to trigger later an adhesion!
Have a look to the article WebRTC Statistics using getStats that describes other common mistakes.
JavaScript getStats API
When calling the JavaScript API getStats which is asynchronous, you don’t get an array of reports… you receive a RTCStatsReport object.
This object has a complex interface that contains:
-
Several Iterators: Here, you need to call next() to move to the next report:
entries()returns an iterator containing an array with 2 entries: the report id and the report’s stats as anObject.keys()returns an iterator with the report id asvalueandvalues()returns an iterator with the report’s stats as anobject. -
A forEach method: An equivalent to the method
Array.forEach. As for an Array, the callback contains 3 parameters: the report, the report id as index and theRTCStatsReportobject. -
Some helpers: The
get()method allows you to access directly a report by its id. Thehas()method checks that a report exists based on its id.
Some examples
const reports = await pc.getStats();// Using an iterator based on the valueslet iterator = reports.values();let hasFinished = false;do {const {done, value} = iterator.next();hasFinished = done;// Do something with the value (object containing all stats in that report)// ...} while (!hasFinished);// Using the for...of statement on the iteratorfor (let report of reports.values) {// Do something with each report// ...}// Using the forEach methodreports.forEach((report) => {// Do something with each report// ...});// Direct access to a report using its idconst reportId = "RTCCodec_1_Inbound_39";let report = null;if (reports.has(reportId)) {report = reports.get(reportId);}
As it is not something common, most developers today use the method forEach that does the job well. But if you want to not parse all reports other methods fit better.
Stats requires a WebRTC diploma
As the getStats API gives you direct access to low level information, you need to know the meaning of the statistic you want to use to be sure it is relevant.
For example, nackCount, firCount, pliCount, qpSum, totalSquaredInterframeDelay… Some are still a mystery to me!
Then, if you want to know more, you have several alternatives:
-
a) The specification Identifiers for WebRTC’s Statistics API but sometimes this document is complicated to understand because the audience is the browser vendors.
-
b) The MDN Web docs promoted by Mozilla. A great source for Web developers but sadly, only the
getStatsmethod is described, no information on the data collected… -
c) The WebRTC Community: Hopefully, a lot of information could be found on Internet. My preference goes to WebRTCHacks, BlogGeek.Me, WebRTC.Ventures and for sure Discuss-WebRTC Google Group.
Note: Alternatively, to have an idea on the current discussion around WebRTC topics including the statistics, the W3C sessions are recorded as well as the slides. Everything is accessible in the W3C website. A second diploma is required here :-) but very interesting!
Panorama of WebRTC Statistics usage
The WebRTC statistics API can be used in many ways. I tried to summarize the main use cases the API offers and listed some actors.
Note: Don’t be surprised of the examples or products chosen. They are those I know the most: either because I’m a developer of that product or because I already used it.
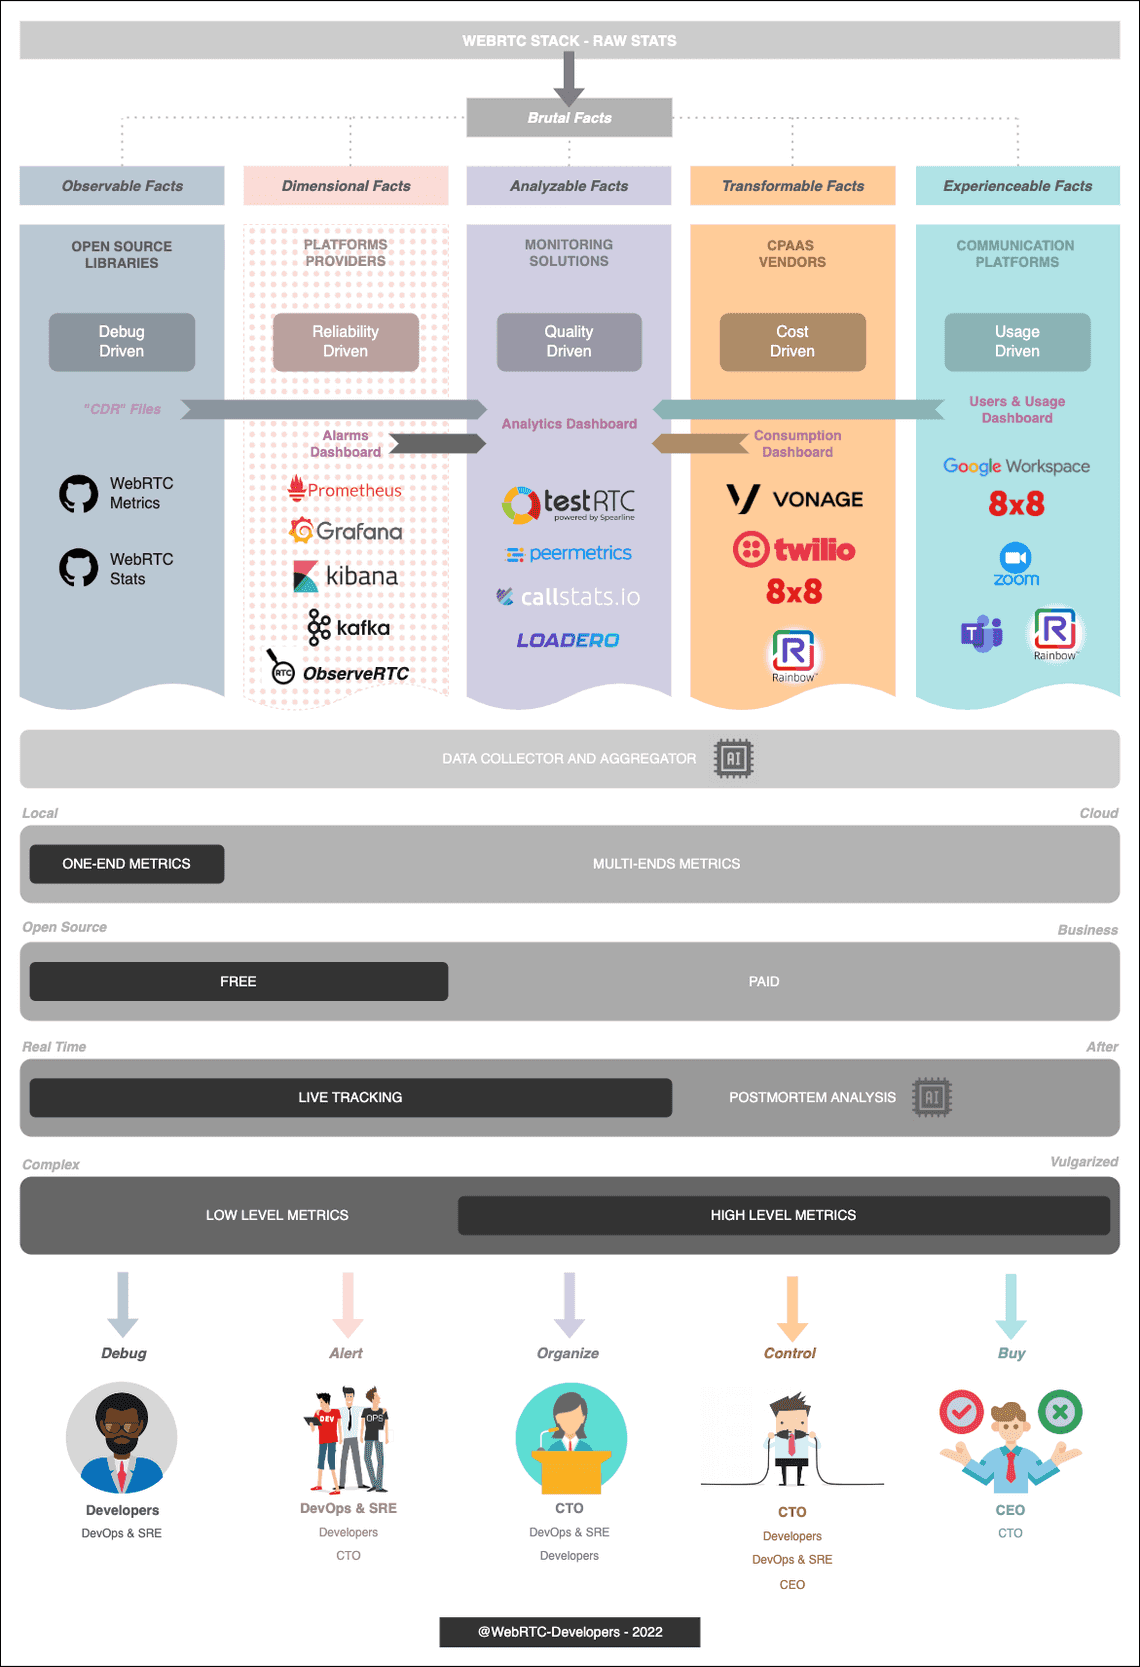
Open-source libraries
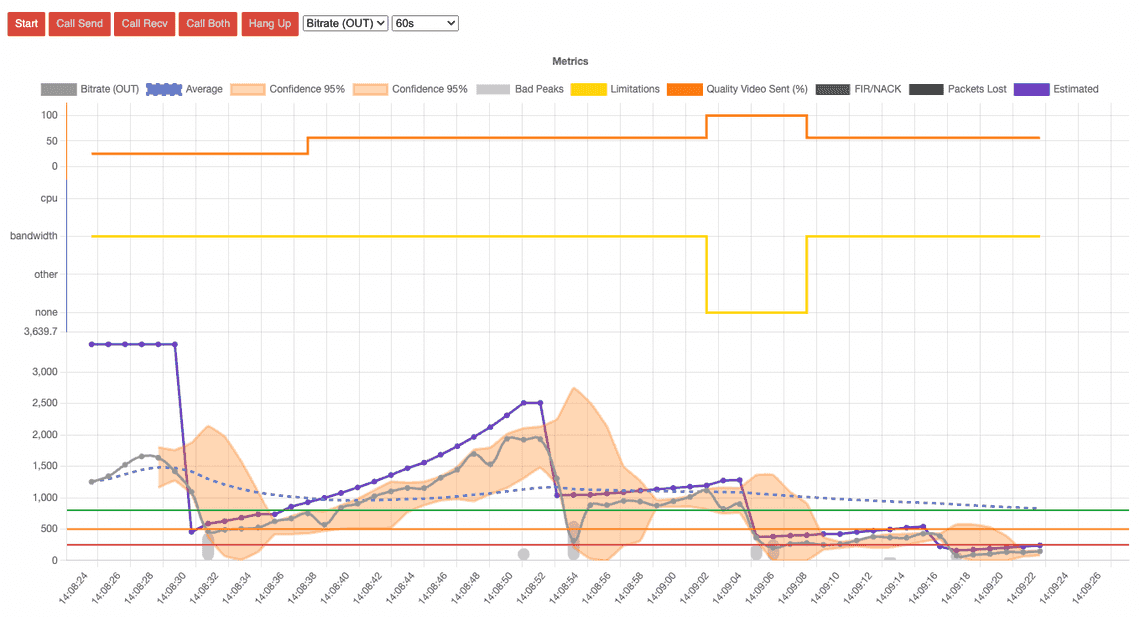
There are not a lot of open-source libraries dedicated to statistics. I’m developing my own WebRTCMetrics.
The reason is simple: Most of WebRTC developers either take the statistics from the SDK they used (eg: Twilio, Vonage, …) or manage them internally in their applications. But for those, who do nothing, I encourage them to choose one of these 3 solutions (open-source, managed or own-sourced).
PRO
- Decouple the application from the specification
- Browsers compliant (Homogenous debug)
- Lots of statistics & metrics computed
- Live and post-mortem analysis
CONST
- Additional library to add
- Limited to one end (incomplete for the others)
- Often limited to one language (JavaScript here)
Platform Providers
(Foundation of the 2 next categories)
I have dedicated a separate category here even though it is not related to a product or solution but rather to a dedicated team that keeps a solution alive.
Most of the time the existing SRE team or DevOps have developed dashboards based on statistics collected by the existing backend (The front-end applications pushing their statistics to the backend). So here, it’s more an indirect usage of WebRTC statistics.
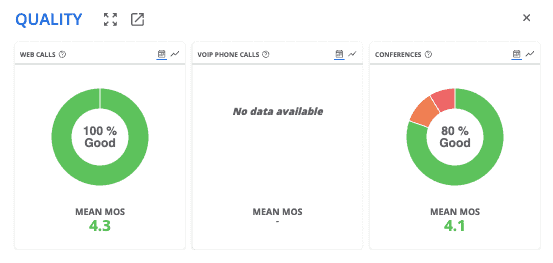
And to help them focus on what’s wrong, thresholds are defined that trigger alarms when they are exceeded: For example, when there is more than 1% of calls in error in the last hour or when the average call quality is below 3.5 (MOS) in the last day, …
Tools like Graphana, Loki, Prometheus, Kibana and Apache Kafka and a lot of other are used to focus on the interesting data containing statistics for monitoring the solution.
These tools are nothing in common with WebRTC but as statistics are “formatted” data, they can be exploited and so these tools can work on them as for any data.
To notice: ObserveRTC that is an open-souce solution dedicated to collect and aggregate webRTC stats in your own cloud.
PRO
- Mandatory to understand what happened, not a question
CONST
- Mandatory to understand what happened, not a question
Monitoring Solutions
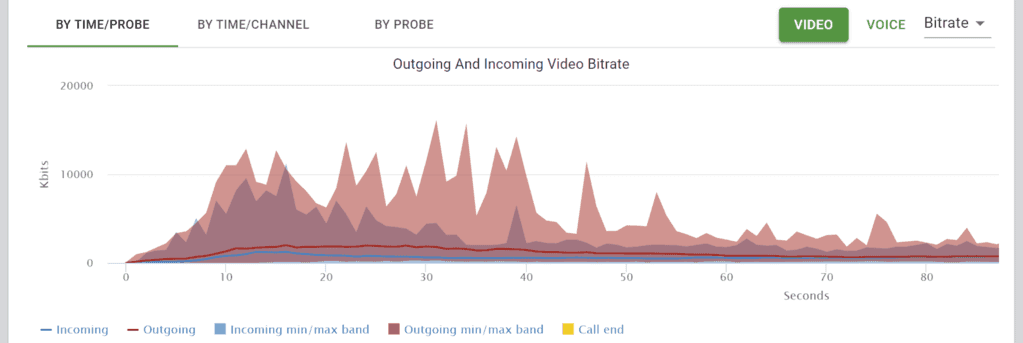
In this category, we found Cloud platforms that help you to improve the quality of your product. They collect and analyze WebRTC statistics and are able to give you feedback at different levels: From checking a metric in an individual video stream, to looking at the overall key metrics for a conference. You have access to a large number of statistics about the call made.
It is not possible to summarize all the features offered by these platforms (not all are equals), but they are able to monitor your solution live: If a user complains, you have all the data to analyze what happened and so can take counter-measures.
Generally speaking, these platforms collect many WebRTC statistics on their side (in compliance with legal rules), compute high-value metrics and display them in the form of graphs, tables or alerts while keeping your data during a certain period.
A platform like TestRTC provide tools for regularly testing your WebRTC solutions (as users might do) in different conditions and using browsers that are not yet released to anticipate. Then gives you feedback and alerts. This type of service can save you a lot of energy while ensuring that your application is compatible with evolving browsers.
PRO
- 360° analysis of your solution in different conditions
- Multiple-ends statistics
- Statistics aggregation at different levels: Stream, User, Conference, all usage
- Live and post-mortem analysis
CONST
- Paid service
- Collect (technical) data
- Integrated to your solution
CPaaS providers
In a nutshell, CPaaS providers offer mainly SDK(s) to include in your application with methods or API to connect your users to audio and video collaborative sessions with other participants. All or part of the service is managed within their infrastructure.
Most of the time, you paid for what you consume but each provider has its own business model: Sometimes, you have an additional monthly subscription where you can receive a bill even if you do nothing…
So, it is the SDK that uses WebRTC to make the calls and therefore provides your application with some statistics that they collect through events or callbacks and sends these statistics to their servers. As in the previous category, they collect statistics but offer less possibilities than dedicated solutions and retention period is shorter.
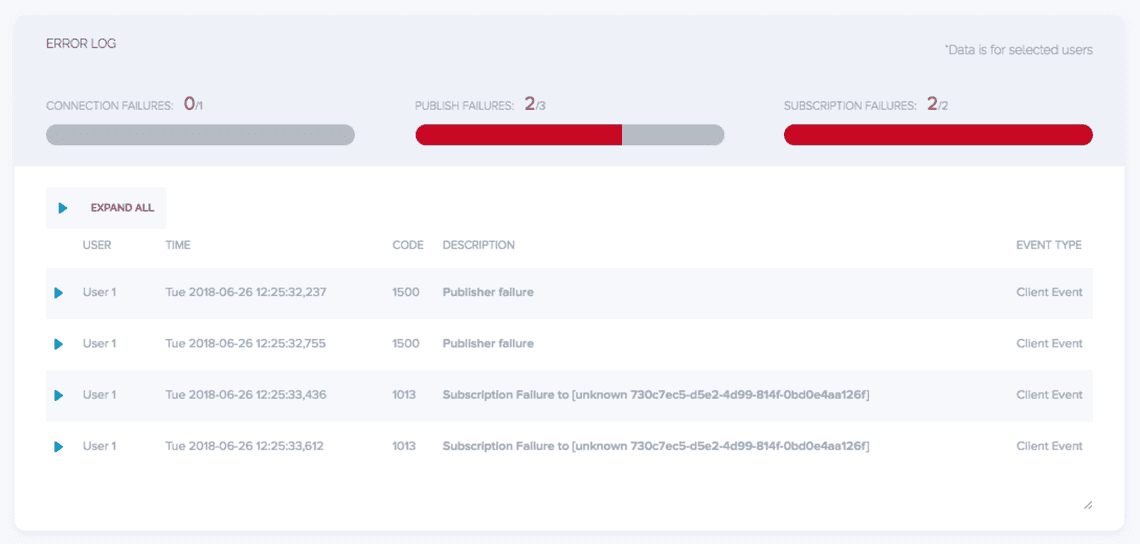
Vonage offers a tool called Inspector for helping developers, integrators to understand what happened: The Inspector shows high-level statistics, metrics around quality as well as a call history containing the errors in case of.
Dedicated Turn hosted solutions mainly use the traffic bytesSend, bytesReceived that passes through their infrastructure to bill you.
PRO
- “All in one” service
- Decouple the application from the specification (specification compliant)
- One end statistics + multiple-ends (if exposed)
- Live and post-mortem analysis
CONST
- Collect (technical) data and expose a limited set only
- Short retention period (pay for more)
Communication and Collaboration Platforms
The last category is Communication and Collaboration platforms where we found UCaaS solutions like Teams, 8x8, Zoom and the Hybrid Business solutions (connected to existing telephony investment) like Rainbow.
There, WebRTC statistics are mainly used to:
-
Add end-users serviceability features such as detecting problems with the microphone (eg: accidental mute, no audible sound, etc…) or detecting a bad environment (eg: low bandwidth, processor constraints, etc…)
-
Debug and improve the whole solution: Some statistics are collected for every call to have quality dashboard. And for users complaints, statistics are mixed with the logs collected by the Customer Support to help understand what went wrong.
-
Provide usage metrics: These metrics are reported at several levels: At user level, at the enterprise level for the admin and at Business Partner level for indirect resell.
Depending on the audience, statistics are more or less complex and meet all needs: Sales and Marketing, Customer success, Support, SRE and Development.
PRO
- Global experience improved
CONST
- Statistics usage to retain users through golden signals (Trust only sovereign cloud solutions…)
Native WebRTC stacks
The following has to be taken with care. I didn’t use native stacks directly. All elements have been found from the source or API documentation. Don’t hesitate to amend in case of errors.
LibWebRTC
Most of the elements presented in that article are extracted from the W3C getStats JavaScript API offered by the browser.
I never used the native API from the LibWebRTC so not sure how different it is.
I tried to found some explanations but Google WebRTC Native documentation is missing some parts…
From the source code, it seems that the stats are located in different places: API Definition and implementation here and here.
Pion
Pion seems to offer an API quite similar to the one defined by the W3C. Source available here: stats.go
SIPSorcery
SIPSorcery has a RTCPeerConnection interface with some methods similar to the Web. Unfortunately, there is no getStats methods. But it seems that you just need to subscribe to events like OnReceiveReport, OnSendReport. These events are for diagnostic only and seems to contain only little information (Jitter, packets lost, packets sent, bytes sent and perhaps some others).

