Debugging WebRTC in the browsers
Table Of Contents

As the summer is coming here in France (long awaited this year), I would like to spend more time outside rather than locked up analyzing bugs.
To do that, I reviewed the ways of debugging with browsers to see if there had been any progress over time and, above all, to be as efficient as possible and therefore save time…
When developing Web applications, we spend a lot of time in the debugger for checking logs, network responses or for debugging live step by step.
In the early days, the developer tools in browsers were not sufficient for WebRTC, to help the developers understanding what happened. So new tools have been developed to have access to the underlying WebRTC information as much as possible.
But, depending on the browsers, the effort to offer such tools for debugging WebRTC were not at the same level.
On my side, I take the habit to develop mostly using Chrome whatever I have to do and even if I use my editor to debug rather than the browser tooling.
So, I tried here to spend time in other browsers too to check if they have brought some enhancements.
Here’s a summary of how to debug in different browsers in 2023.
Take-way
If you just want to have an overview of the existing ways to debug WebRTC in the browsers, I made a quick table with all the tools tested in this article.
| Browser | Tool | Target | Used to debug |
|---|---|---|---|
| Chrome | WebRTC Internals - Viewer and Dump | Web Dev | Signaling, Apis, Quality metrics |
| Chrome | WebRTC Internals - Events Logs | LibWebRTC Dev, Expert Dev | WebRTC inside, network |
| Chrome | WebRTC Internals - Audio records | Web Dev, Testers | Audio quality |
| Chrome | WebRTC Logs | LibWebRTC Dev, Web Dev | WebRTC inside |
| Chrome | Chrome Logs | LibWebRTC Dev | WebRTC inside |
| Chrome | Media Internals | LibWebRTC Dev, Expert Dev | Media, Devices |
| Chrome | Media Panel | Expert Dev | Media |
| Firefox | about:webrtc | Web Dev | Signaling, Quality metrics |
| Firefox | Media panel | Web Dev | getUserMedia |
| Firefox | Firefox Logs | Expert Dev | WebRTC inside |
| Safari | Webrtc Logs | Web Dev | WebRTC inside, Statistics |
Debugging WebRTC in Chrome
Without any suspense, Chrome is still far ahead of all browsers in terms of WebRTC debugging.
There are several tools available or ways to capture interesting WebRTC information for live or post-mortem debugging.
WebRTC-Internals - Viewer & Dump
All WebRTC developers should know about the WebRTC Internals tool. This is the must-have.
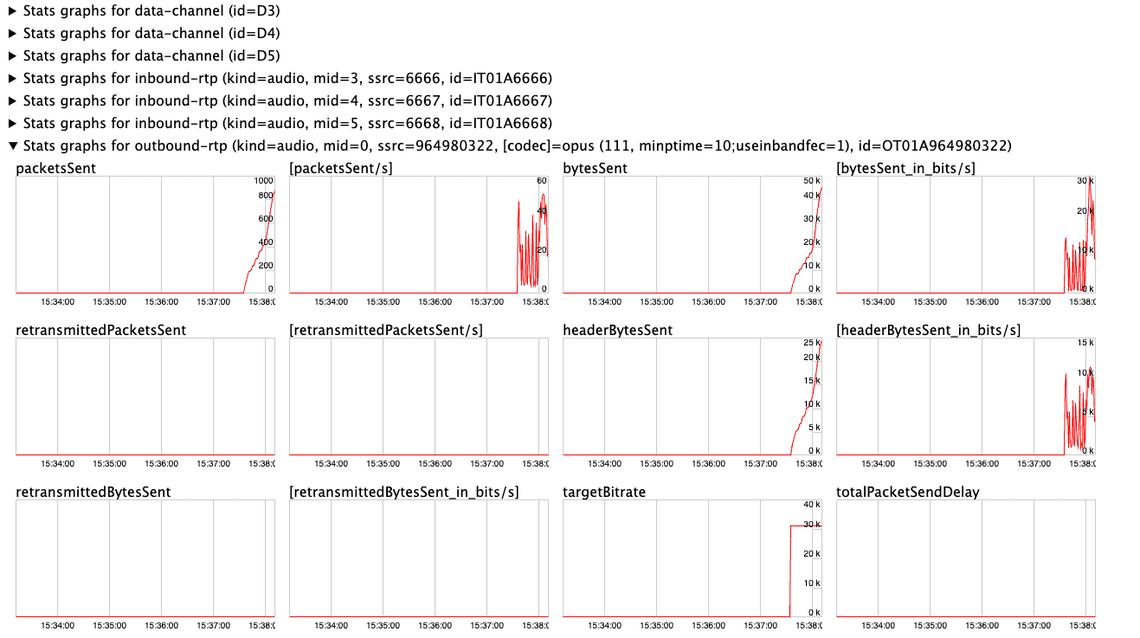
I didn’t succeed to find when it has been released but as far as I remember, it was available.
If you want to have more information on how to use it, here is a link that describe the tools The WebRTC-Internals API trace
WebRTC-Internals is interesting because it gives you:
The connecting part: which means that you know how the call was done (its status, the device and constraints used, the ICE route used and the codecs negotiated) or not (issues)
The events log: Each time a webRTC method has been called, you have its input as well as the result. WebRTC events on the peer connection are logged too.
The numbers: You have access to all the statistics collected: The ones defined by the W3C (those supported by Chrome) + the ones computed by Chrome (those in
[]) + the experimental ones proposed by Chrome (those ending with*).The graphs: If you prefer looking at graphs, each statistic has its own graph.
As stats captured can disappear as soon as the WebRTC call has been released from Chrome and as it can be interesting to keep these logs for post-mortem analyzis or to compare several logs, there is an option to export these dump files.

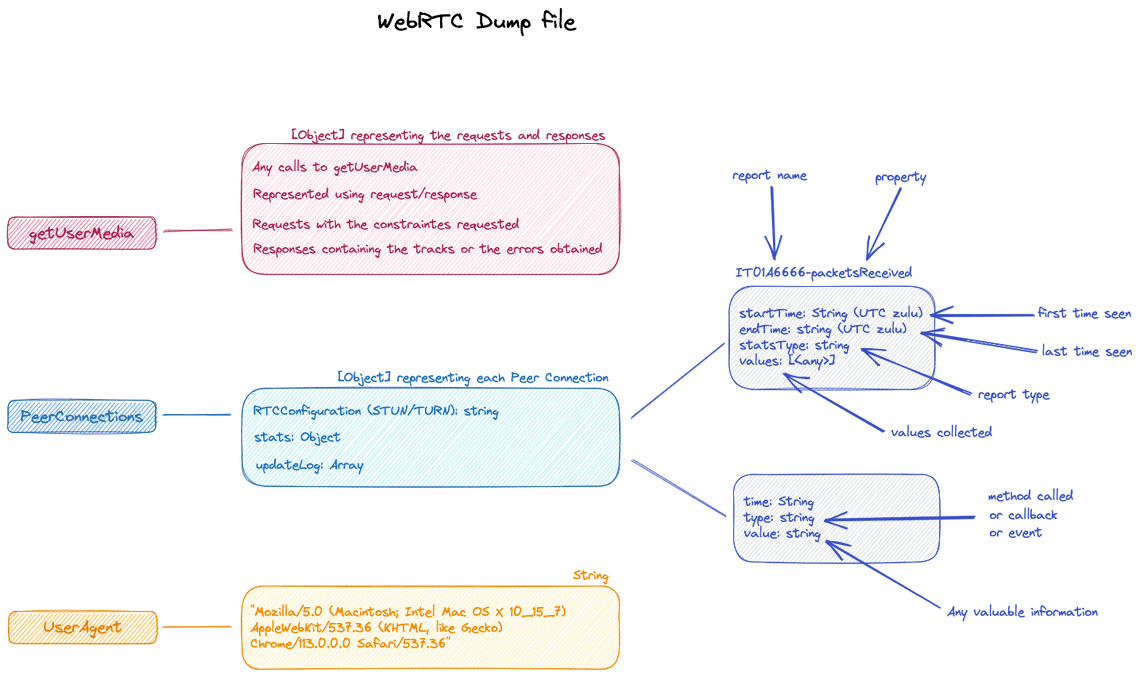
This is a text file but hopefully with a valid JSON valid content which contains all information collected and displayed previously on screen.
From this file, you have 3 (at least) possibilities to debug:
- Open the file from your favorite editor and dig into it. The content of the file is not complicated to understand. Here is a quick overview of the structure.
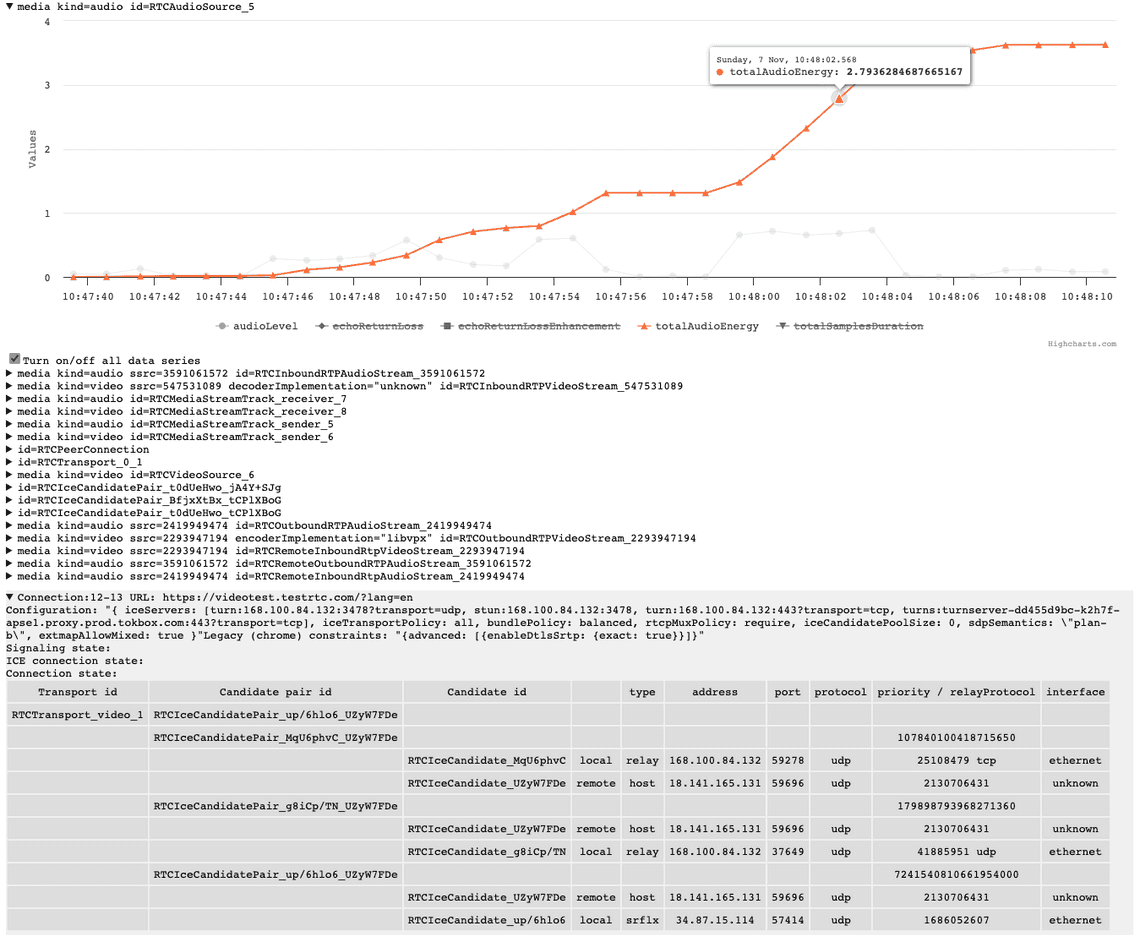
- Use the WebRTC-dump-importer which is a free tool provided by Philipp Hancke. Here, you can upload a dump and see again the WebRTC statistics collected.
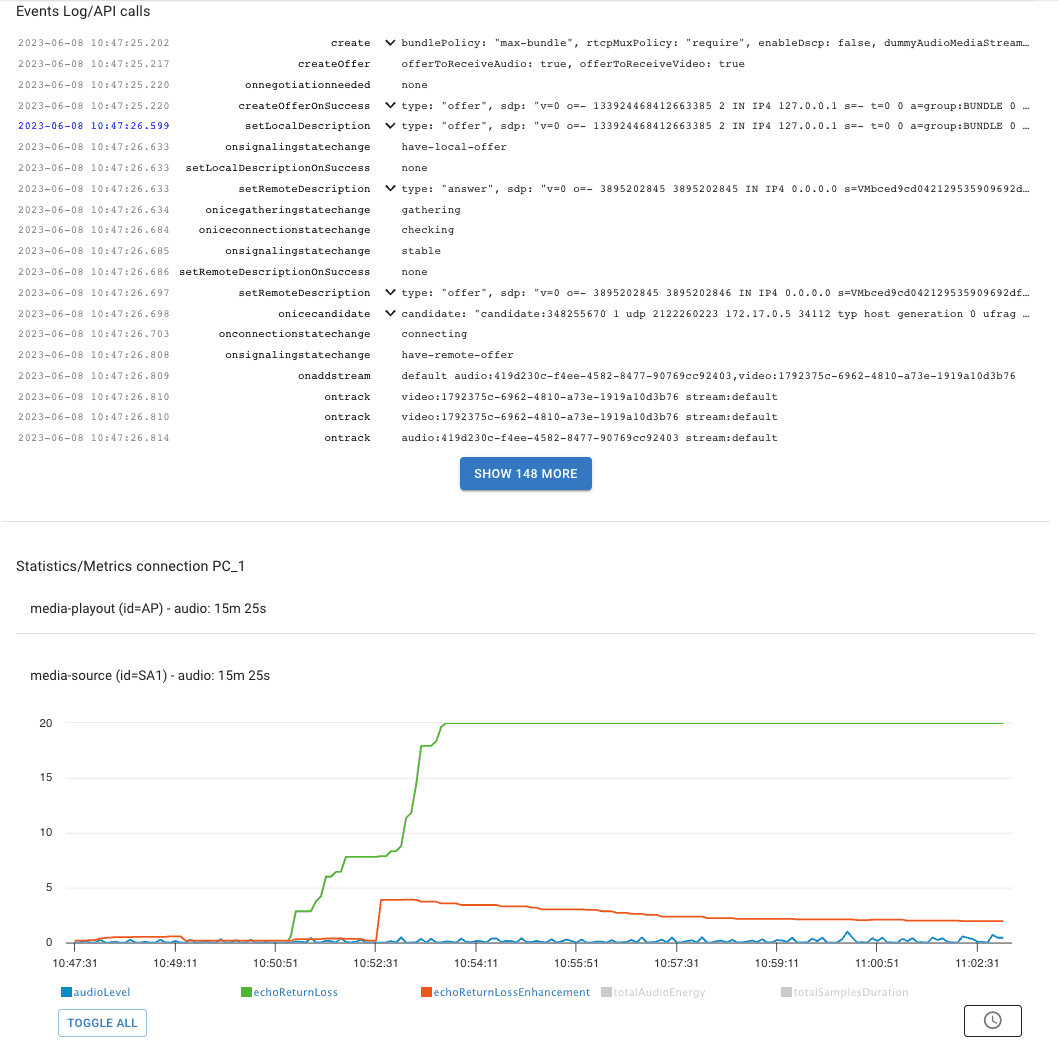
- Use a paid solution like testRTC where you can upload the dump file using the AnalyzeRTC tool and get a lot of additional useful information. This AnalyzeRTC tool is one of the tools proposed by this WebRTC testing and monitoring platform.
And finally, as the statistics continue to evolve, the WebRTC-Internals tool is updated regularly depending on these WebRTC evolution.
If you need to debug WebRTC at client side, and you are using Chrome, WebRTC-Internals is THE tool to use.
WebRTC Internals - Event Logs
From the WebRTC-Internals tool, there is more… If you click on the select box Enable diagnostic packet and event recording, this will generate the WebRTC Event log. You just need to select where to put this file.
Once your call has been done, you have access to a file called such like event_log_20230613_1627_1066_1.log which is not a text file.
This log is used mainly to analyze issues related to jitter buffers or bandwidth estimation.
This file is encoded (I’m not sure if it is based on protobuf) so you can’t directly use it without a parser.
You can find additional information on the structure of this Event logs if you want to parse it here: RTC Event Log or in the Google Group where there is currently a thread about this event log because Google made some changes on the format: PSA: New format for WebRTC event logs in Chrome.
Hopefully again, Philipp Hancke wrote a Web tool to visualize these logs. You just need to upload your file in the WebRTC Event Log viewer

From this tool, you can download a pcap file if you need to debut at packets level using Wireshark.
Reserved to WebRTC Experts. Not useful for debugging WebRTC signaling problems or API usage.
WebRTC Internals - Audio records
In the same way, if you click on the Enable diagnostic audio recordings, this will generate several files:
an audio_debug.input.wav which is a recording of the sound captured by your microphone
an audio_debug.output.wav which is a recording of the sound played out to the speaker
an AEC dump file which I didn’t know what to do with…
Note: I found this old thread: How to utilize webrtc diagnostic audio recording (audio.aecdump) ? but not sure if the answer is still correct. Some projects exist in GitHub that parse this file.
An easy way to compare the sound captured from your microphone to the sound played from the recipient speaker. QA team will love them.
WebRTC-Logs
WebRTC-Logs is not really a tool but rather it shows you the list of logs you have captured.
When you have calls using Chrome, you can collect the underlying logs dedicated to WebRTC. I’m not sure if I did something to activate them or not but after a while, I got some logs.
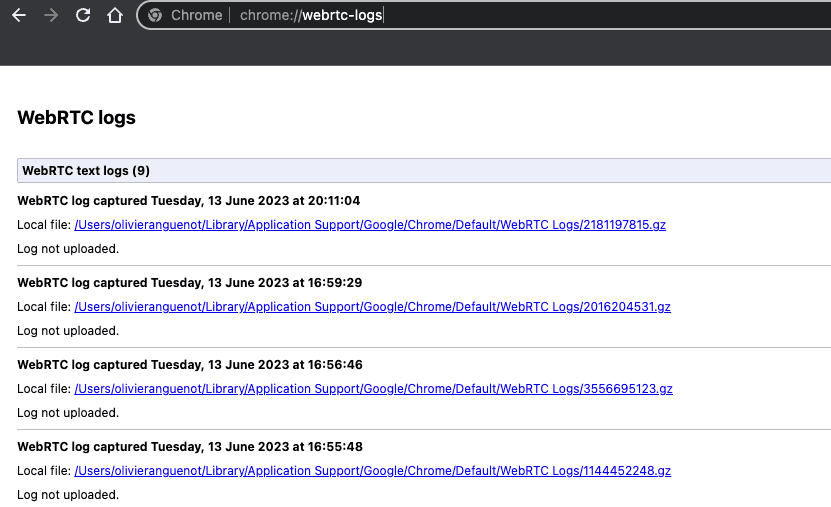
Clicking on these links do nothing on my side. I had to go manually to the directory and to extract the files. Content is a text file.
Here is an extract of the logs collected during a Google Meet session:
[008:583, 15:44:10.608] OnConstraintsChanged this 0x10c01c27200 min_fps 15 max_fps 15[008:586, 15:44:10.608] ConfigureEncoder requested.[008:618, 15:44:10.608] WMPMS::WebMediaPlayerMS({delegate_id=8}, {is_audio_element=false}, {sink_id=}) [delegate_id=8][008:618, 15:44:10.608] WMPMS::SetVolume({volume=0.00}) [delegate_id=8][008:618, 15:44:10.608] WMPMS::Load({load_type=MediaStream}) [delegate_id=8][008:618, 15:44:10.608] WMPMS::SetNetworkState => (state=Empty) [delegate_id=8][008:618, 15:44:10.608] WMPMS::SetReadyState => (state=HaveNothing) [delegate_id=8][008:618, 15:44:10.608] WMPMS::Load => (stream_id=2f07fadb-a023-4326-87c9-3e7e784b01f0) [delegate_id=8][008:618, 15:44:10.608] MSRF::GetAudioRenderer({web_stream_id=2f07fadb-a023-4326-87c9-3e7e784b01f0}, {device_id=})[008:618, 15:44:10.608] WMPMS::Load => (video_track_id=081007b0-e370-49bd-a0e8-fa57d813c80e) [delegate_id=8][008:621, 15:44:10.608] ProcessConstraints min_fps 15 max_fps 15 broadcasting to 1 sinks.[008:621, 15:44:10.608] OnConstraintsChanged this 0x10c01c27200 min_fps 15 max_fps 15[008:622, 15:44:10.608] StartPerRtpStream: {1}[008:622, 15:44:10.608] ConfigureEncoder requested.[008:640, 15:44:10.608] ProcessConstraints min_fps 15 max_fps 15 broadcasting to 1 sinks.[008:640, 15:44:10.608] OnConstraintsChanged this 0x10c01c27200 min_fps 15 max_fps 15[009:716, 15:44:11.553] video capture: First frame received at VideoCaptureController[009:733, 15:44:11.570] video capture: First frame received for this VideoCaptureImpl instance[009:736, 15:44:11.573] Resetting timestamp translation after averaging 0 frames. Old offset: 0, new offset: 101719955266[009:741, 15:44:11.796] Video frame parameters changed: dimensions=640x360, texture=1.[009:742, 15:44:11.796] Matched SdpVideoFormat Codec name: VP9, parameters: { profile-id=0 useadaptivelayering=true useadaptivelayering_v2=true } with Codec name: VP9, parameters: { profile-id=0 }, scalability_modes: [L1T1, L1T2, L1T3, L2T1, L2T1h, L2T1_KEY, L2T2, L2T2h, L2T2_KEY, L2T2_KEY_SHIFT, L2T3, L2T3h, L2T3_KEY, L3T1, L3T1h, L3T1_KEY, L3T2, L3T2h, L3T2_KEY, L3T3, L3T3h, L3T3_KEY, S2T1, S2T1h, S2T2, S2T2h, S2T3, S2T3h, S3T1, S3T1h, S3T2, S3T2h, S3T3, S3T3h][009:743, 15:44:11.796] Webrtc quality scaler for vp9 is enabled.[009:752, 15:44:11.796] Reducing number of spatial layers from 3 to 2 due to low input resolution.[009:752, 15:44:11.796] Reducing number of spatial layers from 3 to 2 due to low input resolution.[009:752, 15:44:11.796] WMPMS::SetReadyState => (state=HaveNothing) [delegate_id=8][009:752, 15:44:11.796] WMPMS::SetReadyState => (state=HaveMetadata) [delegate_id=8][009:752, 15:44:11.796] ReconfigureEncoder: Simulcast streams:0: 640x360 min_kbps: 30 target_kbps: 560 max_kbps: 560 max_fps: 60 max_qp: 56 num_tl: 3 active: trueSpatial layers:0: 320x180 min_kbps: 49 target_kbps: 95 max_kbps: 142 max_fps: 60 max_qp: 0 num_tl: 3 active: true1: 640x360 min_kbps: 193 target_kbps: 305 max_kbps: 418 max_fps: 60 max_qp: 0 num_tl: 3 active: false[009:761, 15:44:11.796] Created scalability structure L2T3_KEY[009:769, 15:44:11.796] WMPMS::SetVolume({volume=0.00}) [delegate_id=8][009:769, 15:44:11.796] WMPMS::Play() [delegate_id=8][009:829, 15:44:11.796] Registered resource "EncoderUsageResource".[009:836, 15:44:11.796] QP thresholds: low: 149, high: 205[009:836, 15:44:11.796] QP thresholds: low: 149, high: 205[009:836, 15:44:11.796] Registered resource "QualityScalerResource".
These WebRTC-Logs are interesting if you want to understand how it works under the hood.
If you see something strange in the WebRTC-Internals - Dump tool that you want to understand, the next step is to use the WebRTC-logs and analyze the logs collected. This should give you some indications on why the browser reacted like this.
Chrome logs
This is the logs got when using the command chrome --enable-logging --vmodule=*/webrtc/*=1.
Note: On Mac, you should launch using this command /Applications/Google\ Chrome.app/Contents/MacOS/Google\ Chrome --enable-logging --vmodule="*/webrtc/*=1"
Once you made your call, quit Chrome and go to the same directly as previously in ~/Library/Application Support/Google/Chrome. You should see a file called chrome_debug.log.
Here is an extract of the Chrome-Logs approximately about the same part as in the WebRTC-Logs but not captured from the same call.
[54331:14595:0609/164632.528647:VERBOSE1:video_stream_encoder.cc(1579)] Incoming frame dropped due to that the encoder is blocked.[54331:14595:0609/164632.528716:WARNING:video_stream_encoder.cc(1541)] Same/old NTP timestamp (3895310792527 <= 3895310792527) for incoming frame. Dropping.[54331:14595:0609/164632.528961:VERBOSE1:webrtc_logging.cc(35)] Same/old NTP timestamp (3895310792527 <= 3895310792527) for incoming frame. Dropping.[54337:56843:0609/164632.528960:VERBOSE1:echo_remover.cc(339)] Gain change detected at block 158[54331:88835:0609/164632.537643:VERBOSE1:text_pcap_packet_observer.cc(51)]I 05:17:40.919 0000 13 88 13 88 76 8f 0f 5a b6 10 f7 8b 00 07 00 f2 52 bb c4 35 00 6f 00 00 ... 1a 20 83 ff 83 00 63 10 13 07 43 04 23 00 4b bd c5 d8 01 01 00 00 00 00 # SCTP_PACKET DcSctpTransport2[54331:88835:0609/164632.537760:INFO:probe_controller.cc(300)] Measured bitrate: 303372 bps Minimum to probe further: 1260 kbps upper limit: +inf bps[54331:88835:0609/164632.537778:VERBOSE1:webrtc_logging.cc(35)] Measured bitrate: 303372 bps Minimum to probe further: 1260 kbps upper limit: +inf bps[54331:88835:0609/164632.537794:VERBOSE1:goog_cc_network_control.cc(702)] bwe 105460919 pushback_target_bps=303372 estimate_bps=303372[54331:88835:0609/164632.537807:VERBOSE1:pacing_controller.cc(184)] bwe:pacer_updated pacing_kbps=334 padding_budget_kbps=0[54331:14595:0609/164632.537857:VERBOSE1:video_stream_encoder.cc(2328)] OnBitrateUpdated, bitrate 237740 stable bitrate = 234368 link allocation bitrate = 237740 packet loss 0 rtt 0[54337:56843:0609/164632.538963:VERBOSE1:echo_remover.cc(339)] Gain change detected at block 161[54337:56843:0609/164632.549003:VERBOSE1:echo_remover.cc(339)] Gain change detected at block 164[54337:56843:0609/164632.559015:VERBOSE1:echo_remover.cc(339)] Gain change detected at block 167[54331:14595:0609/164632.561135:INFO:video_stream_encoder.cc(1778)] Video frame parameters changed: dimensions=640x360, texture=1.[54331:14595:0609/164632.561175:VERBOSE1:webrtc_logging.cc(35)] Video frame parameters changed: dimensions=640x360, texture=1.[54331:14595:0609/164632.561378:INFO:sdp_video_format.cc(164)] Matched SdpVideoFormat Codec name: VP9, parameters: { profile-id=0 useadaptivelayering=true useadaptivelayering_v2=true } with Codec name: VP9, parameters: { profile-id=0 }, scalability_modes: [L1T1, L1T2, L1T3, L2T1, L2T1h, L2T1_KEY, L2T2, L2T2h, L2T2_KEY, L2T2_KEY_SHIFT, L2T3, L2T3h, L2T3_KEY, L3T1, L3T1h, L3T1_KEY, L3T2, L3T2h, L3T2_KEY, L3T3, L3T3h, L3T3_KEY, S2T1, S2T1h, S2T2, S2T2h, S2T3, S2T3h, S3T1, S3T1h, S3T2, S3T2h, S3T3, S3T3h][54331:14595:0609/164632.561399:VERBOSE1:webrtc_logging.cc(35)] Matched SdpVideoFormat Codec name: VP9, parameters: { profile-id=0 useadaptivelayering=true useadaptivelayering_v2=true } with Codec name: VP9, parameters: { profile-id=0 }, scalability_modes: [L1T1, L1T2, L1T3, L2T1, L2T1h, L2T1_KEY, L2T2, L2T2h, L2T2_KEY, L2T2_KEY_SHIFT, L2T3, L2T3h, L2T3_KEY, L3T1, L3T1h, L3T1_KEY, L3T2, L3T2h, L3T2_KEY, L3T3, L3T3h, L3T3_KEY, S2T1, S2T1h, S2T2, S2T2h, S2T3, S2T3h, S3T1, S3T1h, S3T2, S3T2h, S3T3, S3T3h][54331:14595:0609/164632.561458:INFO:libvpx_vp9_encoder.cc(1922)] Webrtc quality scaler for vp9 is enabled.[54331:14595:0609/164632.561471:VERBOSE1:webrtc_logging.cc(35)] Webrtc quality scaler for vp9 is enabled.[54331:14595:0609/164632.561665:WARNING:svc_config.cc(93)] Reducing number of spatial layers from 3 to 2 due to low input resolution.[54331:14595:0609/164632.561694:VERBOSE1:webrtc_logging.cc(35)] Reducing number of spatial layers from 3 to 2 due to low input resolution.[54331:14595:0609/164632.561717:WARNING:svc_config.cc(93)] Reducing number of spatial layers from 3 to 2 due to low input resolution.[54331:14595:0609/164632.561728:VERBOSE1:webrtc_logging.cc(35)] Reducing number of spatial layers from 3 to 2 due to low input resolution.[54331:14595:0609/164632.561753:INFO:video_stream_encoder.cc(1204)] ReconfigureEncoder:Simulcast streams:0: 640x360 min_kbps: 30 target_kbps: 560 max_kbps: 560 max_fps: 60 max_qp: 56 num_tl: 3 active: trueSpatial layers:0: 320x180 min_kbps: 49 target_kbps: 95 max_kbps: 142 max_fps: 60 max_qp: 0 num_tl: 3 active: true1: 640x360 min_kbps: 193 target_kbps: 305 max_kbps: 418 max_fps: 60 max_qp: 0 num_tl: 3 active: true[54331:14595:0609/164632.561765:VERBOSE1:webrtc_logging.cc(35)] ReconfigureEncoder:Simulcast streams:0: 640x360 min_kbps: 30 target_kbps: 560 max_kbps: 560 max_fps: 60 max_qp: 56 num_tl: 3 active: trueSpatial layers:0: 320x180 min_kbps: 49 target_kbps: 95 max_kbps: 142 max_fps: 60 max_qp: 0 num_tl: 3 active: true1: 640x360 min_kbps: 193 target_kbps: 305 max_kbps: 418 max_fps: 60 max_qp: 0 num_tl: 3 active: true[54331:14595:0609/164632.561809:INFO:libvpx_vp9_encoder.cc(164)] Created scalability structure L2T3_KEY[54331:14595:0609/164632.561821:VERBOSE1:webrtc_logging.cc(35)] Created scalability structure L2T3_KEY[54337:56843:0609/164632.569031:VERBOSE1:echo_remover.cc(339)] Gain change detected at block 170[54331:14595:0609/164632.584703:VERBOSE1:video_stream_encoder.cc(1332)] max bitrate 560 start bitrate 237 max frame rate 60 max payload size 1102[54331:14595:0609/164632.584758:INFO:resource_adaptation_processor.cc(117)] Registered resource "EncoderUsageResource".[54331:14595:0609/164632.584772:VERBOSE1:webrtc_logging.cc(35)] Registered resource "EncoderUsageResource".[54331:14595:060
Here, logs are much more complete, with log level, source file name and line of code.
These logs are the official ones to send when creating a new WebRTC issue for Chromium.
Media-Internals
This is the place to investigate media problems in the lower layers.
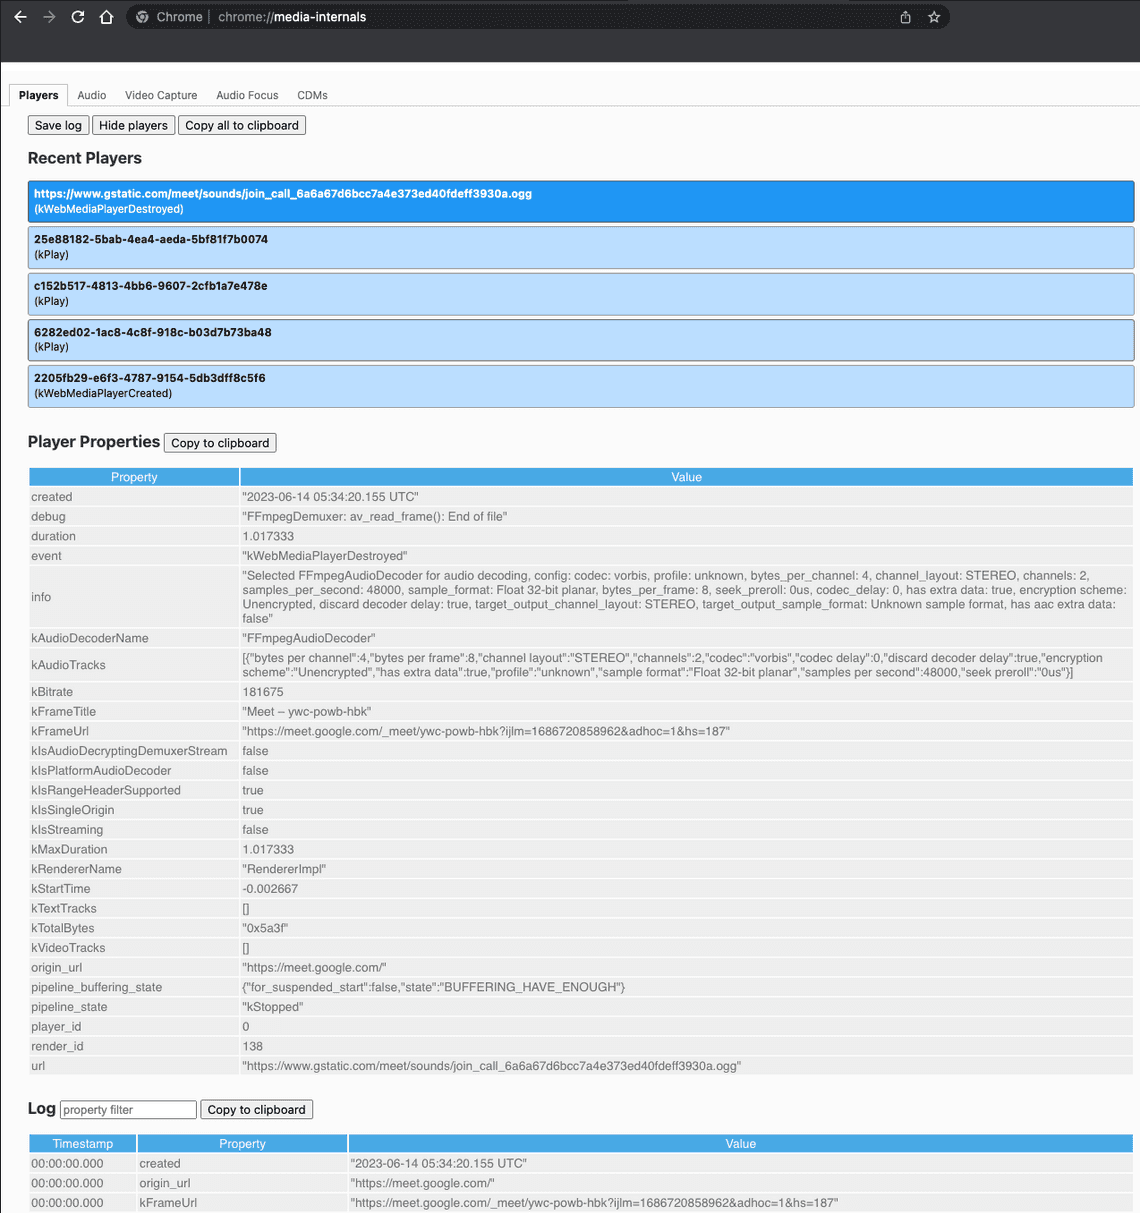
Personally, I never have to dig into this tool. The part I have used is the video capture tab which lists the camera capabilities such as the resolution supported.
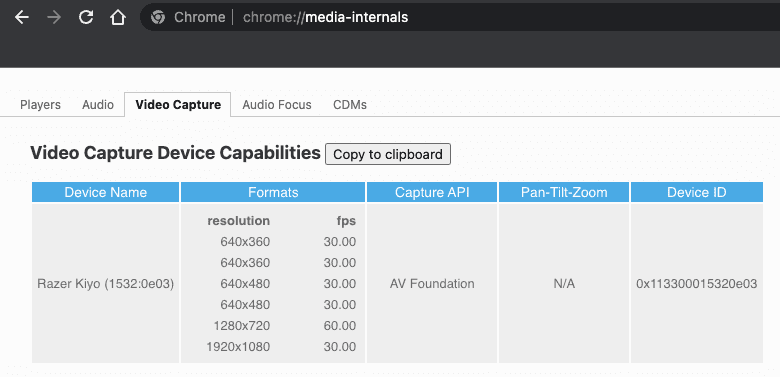
For media experts
Media Panel
In the Chrome Developer Tools, by clicking on the more tools button, you can select the Media Panel to display this tool.
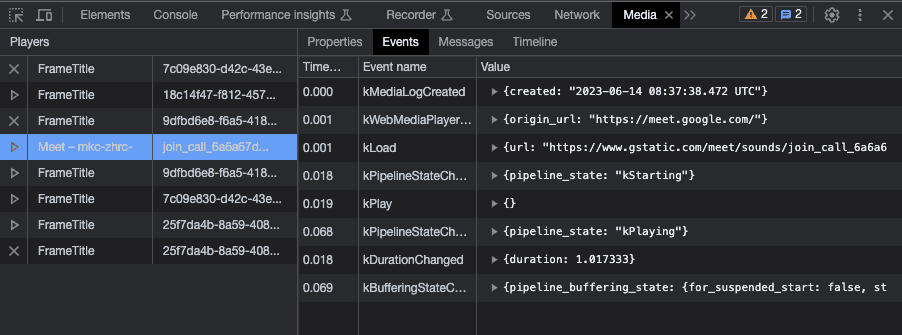
It is dedicated to debug the media player. You can find more information in this article: Media: View and debug media players information
For media experts
Debugging WebRTC in Firefox
Time to see how to debug WebRTC in Firefox!
Firefox “about:webrtc”
or about:webrtc
In the same way as Chrome, Firefox has special URLs that starts with about. Here to access the WebRTC debugger, you have to enter about:webrtc.
Since the last time I have used it, this tool made some progress.
Now, you can see some live graphs displaying real time statistics.
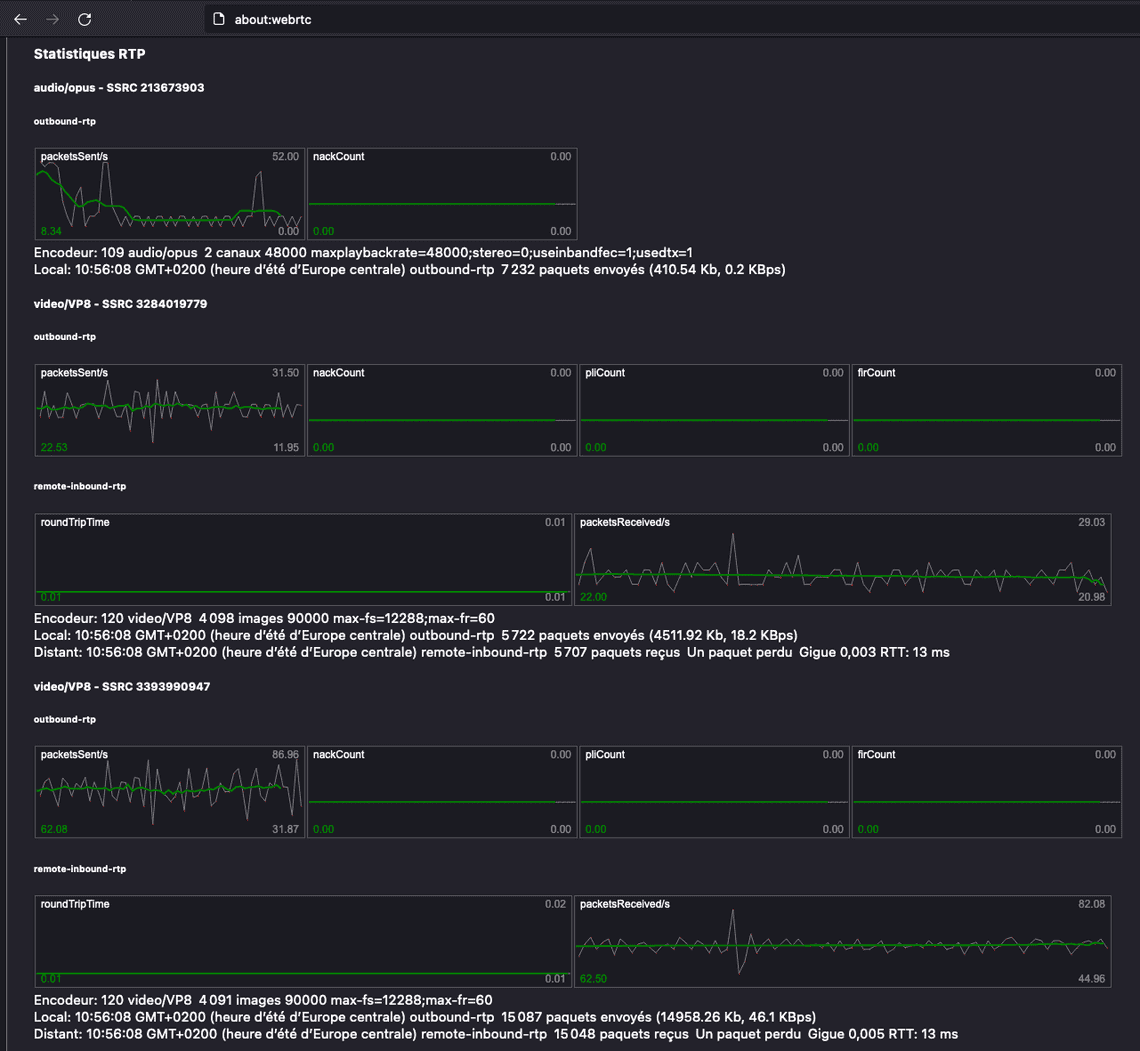
And the associated ICE information

And finally, you have a full connection log from components such as ICE, STUN-CLIENT, ICE-PEER to debug the connection steps. Useful when the connection can’t be established.
Additionally, there are some other things such as the possibility to activate a debug mode (don’t succeed to make it work) and to activate the AEC logging (don’t see any logs in the directly mentioned…)
Firefox offers here an equivalent of the Chrome WebRTC-Internals tool. Even if there is fewer details, you should have the minimum to debug or analyze your calls.
Firefox Media Panel Extension
From Firefox, you can install the Media Panel Extension which display information about media and WebRTC in a separate DevTools panel.
I mention this tool but since 2019, there has been no new version. More information here:Media Panel Extension

Mainly info on getUserMedia. Not very useful now
Firefox logs
The procedure to obtain logs in Firefox is not trivial. I only succeeded doing the following steps:
- Launch Firefox from the command line
export MOZ_LOG=timestamp,rotate:200,nsHttp:5,cache2:5,nsSocketTransport:5,nsHostResolver:5,signaling:5,webrtc_trace:5export MOZ_LOG_FILE=~/Desktop/log.txtcd /Applications/Firefox.app/Contents/MacOS./firefox-bin
Then go to
about:webrtcand activate Start Debug ModeDo your call
Stop the Debug mode and quit Firefox.
Once done, you should obtain several logs files such as log.txt.child-1.moz_log.0 and if you correctly put the module to debug, you should have the information.
In the shell, some additional information are put regarding on the signaling part.
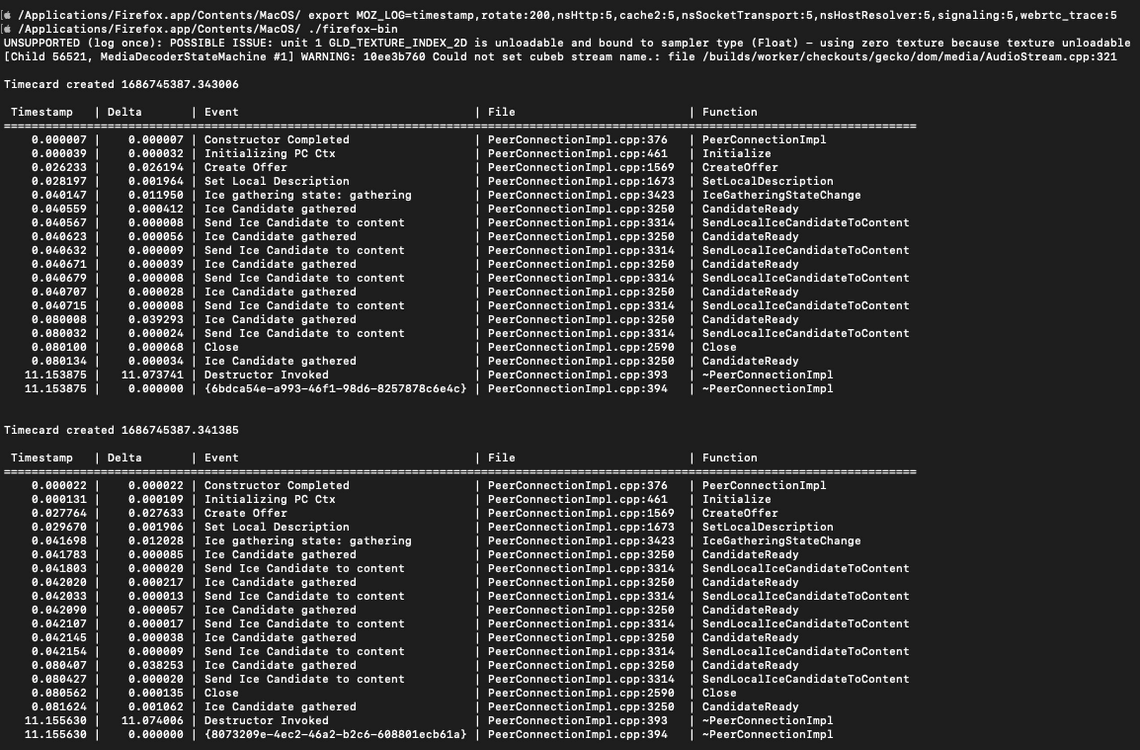
Some additional information could be found here Media/WebRTC/Logging
This is the logs to submit when submitting a new bug for Firefox.
Debugging WebRTC in Safari
Debugging WebRTC in Safari is as easy as it is limited…
Safari WebRTC logging
If you want to see WebRTC logs in the developer console, you need to activate them:
Open the Developer tool
Click on Settings
In the Console panel, activate the options WebRTC logging depending on your need. Except in some cases, you will not need to activate the others.
When activated at basic level, the console gives you all the information on what happens internally.
When activated at verbose level, the console also displays the WebRTC statistics as if you’d called the getStats api with a frequency equals to 2 seconds.
It’s strange to mix everything up in the default console. Other browsers have preferred to have a dedicated place for WebRTC information, which is much better.
Debugging WebRTC in Safari is not very pleasant. Everything comes to the console. Fortunately, WebRTC logs can be viewed separately from the application logs, but after a few minutes, the Developer Console has a huge response time due to the quantity of logs stored…
And …
That’s all!
I hope to have missed something, but I even didn’t find a way to store Webkit logs to a file (except crash logs that are automatically generated and that can be retrieved through the Console application)
So, debugging WebRTC in Safari is still a pain point in 2023 or still considered as a “black box” which don’t need to expose its internal behavior to Web developers…
Conclusion
Chrome offers a number of tools for debugging WebRTC. Not all of them are dedicated to Web developers, but those who want to deepen their understanding can use advanced tools and collect what they want/need.
Firefox proposes the minimum allowing Web developers to develop and test.
Safari doesn’t offer much, or hasn’t yet understood our needs as Web developers…
Other References
Here are some other links I used for this article:

