Debugging WebRTC on your iPad
Table Of Contents

Debugging a WebRTC Web application on mobile or tablet devices, particularly on an iPad, remains a challenge today, primarily because the necessary tools and development environment are not readily available on these devices.
In comparison, an iPad can feel like a wild animal, resistant to direct interaction: localhost doesn’t exist, HTTPS is required, and there are no built-in developer tools you can access directly.
So, how can you verify that your application is running smoothly without having to wait for a release on your test server?
And more importantly, why is it now essential to test your app on browsers other than Safari on your iPad?
Apple and the EU regulations
With the release of iOS 17.4 in March 2024, Apple has introduced significant changes to its mobile operating system to comply with new EU regulations.
For the first time, Apple will allow alternative browser engines to run on iOS — but only for users in the EU.
Since the launch of the App Store, Apple has permitted multiple browsers but only one browser engine: WebKit. This meant that Chrome on iOS wasn’t truly Chrome as it is on desktop, making WebRTC development and troubleshooting on iOS/iPadOS particularly frustrating due to these limitations.
In short, WebKit is the engine powering Safari, but it’s not the only engine available. Google’s Chrome is built on the Blink engine, which is part of the broader Chromium project used by most browsers today. Edge, Brave, Opera, and many others all use Chromium and Blink, while Mozilla’s Firefox runs on its own engine, called Gecko.
With this regulation now in effect, browsers downloaded from the App Store will use their own native engines.
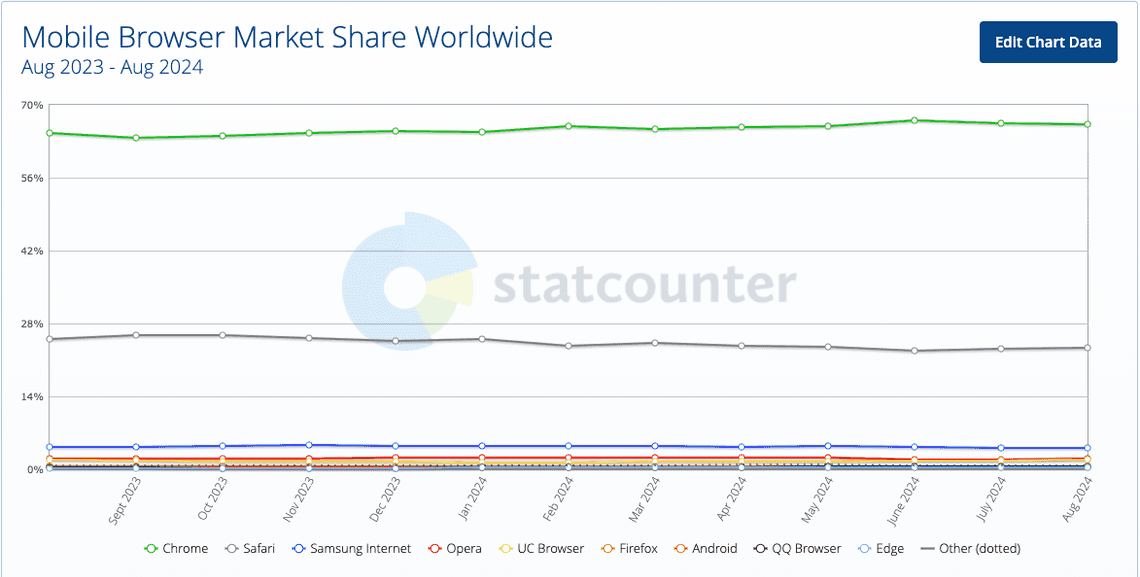
While this change may not dramatically alter browser market share — since users tend to stick with their preferred browsers — it’s something that most EU users won’t notice. However, for developers, it means additional work to support different web engines for their applications on iPads and iPhones. :-)

So, on iOS and iPad, it’s time to thoroughly test how your application performs in Chrome. Testing other browsers may not be as crucial.
iPad is Apple and Apple is a closed ecosystem
What does this mean? Without a Mac, debugging your web application on an iPad is quite limited and difficult.
There are alternative paid solutions, like Inspect, that you can try.
While you can use Chrome on your iPad and view logs via chrome://inspect, it’s not ideal, as the logs open in a separate tab and lack the standard Chrome console formatting.
Personally, I use an Apple-based development setup that enables remote debugging, and I’ll show you how to do that.
If you’re aiming to support Apple devices like iPads and iPhones, relying on a Mac is the best approach!
The infernal certificates chain
Note: These issues aren’t exclusive to Macs—you’ll encounter the same challenges when testing on Android devices.
Most of the time, during development, you’re running your environment locally and using HTTP.
When testing on desktop browsers, this isn’t a problem: WebRTC APIs work fine on localhost over HTTP.
However, the issue arises when you want to test from a tablet, phone, or a second computer. In these cases, you need a public address or domain to connect to, which requires using HTTPS.
In the past, I tried creating my own certificates and adding them to the keychain, but results varied depending on the browser, and it often worked only temporarily. I didn’t invest much time in this, so I may have missed some details. I know there are ways to make it work reliably, and there are plenty of tutorials available on the topic.
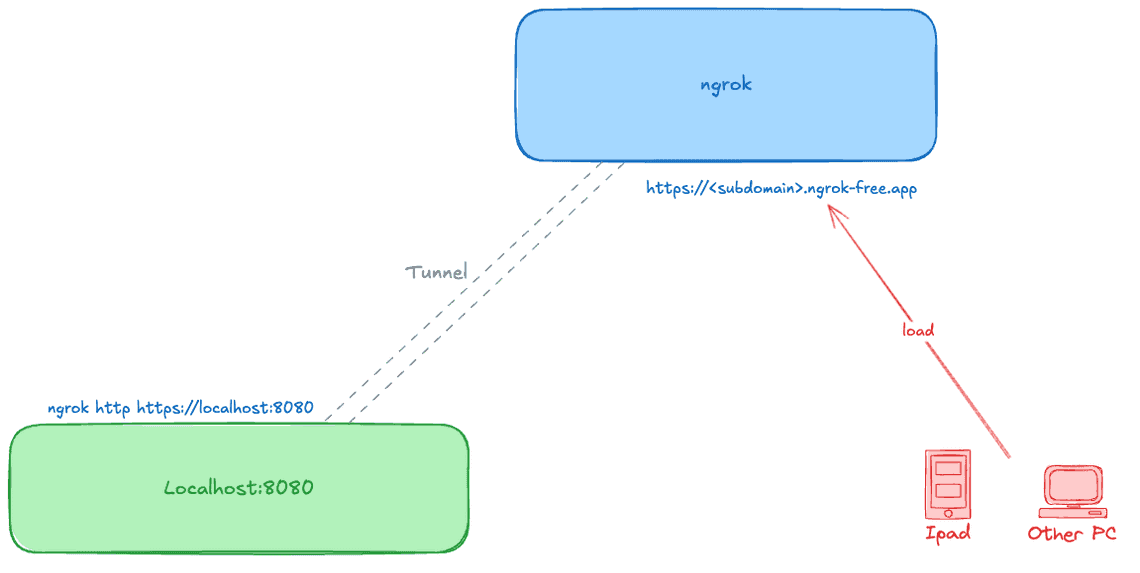
Nowadays, I prefer to use tunneling tools like ngrok to securely expose my localhost server to the cloud.

By using ngrok, I’ve solved two key issues:
Accessing my local development environment from another device without needing to constantly check my internal IP address.
Serving my local development over HTTPS with trusted SSL certificates.
Installing ngrok on my Mac was quick and easy, and within seconds, I could test my local application on my iPad using HTTPS without any SSL-related problems.
For local development, if you don’t want to manage your own certificates, ngrok or similar tools can provide a public URL or endpoint accessible from outside. Ideal for development purposes only!
Debugging your application
Now that your web application is up and running on your iPad, the next step is debugging. Debugging means accessing log messages, setting breakpoints, and checking your code in real time.
This is where you’ll start to appreciate Safari 😅
Why? Because you’ll need to use Safari on your Mac to access the Web Inspector remotely. This method lets you debug any browser on your iPad—whether it’s Safari, Chrome, Edge, or even Firefox.
Let’s walk through how to do it!
Enabling Safari features for Web developers
By default, Safari conceals the tools for web developers, which means you won’t be able to access the console logs, for instance.
To enable them, open Settings and navigate to the Advanced section. At the bottom of the page, you should see the option Show features for Web developers. Make sure to select it!
Once you’ve done this, a new Develop menu will appear. This is where you can access the remote Web Inspector.
Note: Interestingly, I’ve encountered fewer issues using the Safari Technology Preview for remote web inspection. Occasionally, my iPad isn’t recognized in the current version of Safari.
Enabling the Web inspector in the browsers
Next, head over to your iPad and open the browser you wish to use: Chrome, Edge, Safari, or Firefox.
In the browser settings, locate and enable the Web Inspector option.
Note: I couldn’t find this option in Firefox, but it worked without needing to enable it.
Connect you iPad to your Mac
Connect your iPad to your Mac using a USB-C cable.
A new entry representing your iPad should show up in the Develop menu of Safari on your Mac.
Remotely debug your application
Open your ngrok URL in your iPad’s browser and start using it.
In the Develop menu of Safari on your Mac, you should see an entry for the webpage that’s open on your iPad.

Clicking on it will launch the Safari Web Inspector on your Mac.
That’s it! You can now access the developer tools as if they were opened directly on your iPad.
Note: If you don’t see the web page opened on your IPad, try to close and reopen the browser on your iPad.
Add breakpoints, check network data exchanged
In the Web Inspector, under the Sources panel, you can locate your files and set breakpoints for real-time debugging, view the contents of your variables, and more.
The Network panel will allow you to see all requests and responses that are exchanged.
More information about the Safari Web Inspector can be found on the Apple Developer platform - Safari Web Inspector.
Note: Depending on your setup and tools, you may be able to connect to your iPad via Wi-Fi or using Xcode. This has not been tested.
Conclusion
In conclusion, I’ve received numerous inquiries from web developers who primarily use Windows, and as mentioned earlier, I unfortunately don’t have solutions tailored for that environment.
However, for web developers working with macOS, the tools and methods outlined in this article provide a straightforward way to debug your web applications live on an iPad.
By leveraging features like the Safari Web Inspector and tools such as ngrok, debugging becomes not only accessible but also efficient. The process may seem daunting at first, but with the right setup, it can be accomplished with ease.
I hope this article serves as a valuable resource for macOS Web developers looking to enhance their debugging capabilities on iPads. If you have any further questions or need assistance, don’t hesitate to reach out. Happy debugging!
Addendum
Debugging on Android devices (with Chrome) follows a similar approach: Once you enable Developer Mode on your tablet by tapping the build number seven times and activate the USB Debugging option, you can directly access the remote Developer Tools from your Mac using the chrome://inspect command.
No jealousy; everyone has their own remote debugging!

